2020 Q2 RVs Market Report
Industry Overview
RV Market Update
One thing we’ve learned in the past two months is activities that can be done solo or with close friends and family are popular during this time of social distancing. Recreational Vehicles stand to benefit from this change in recreational and vacation habits.
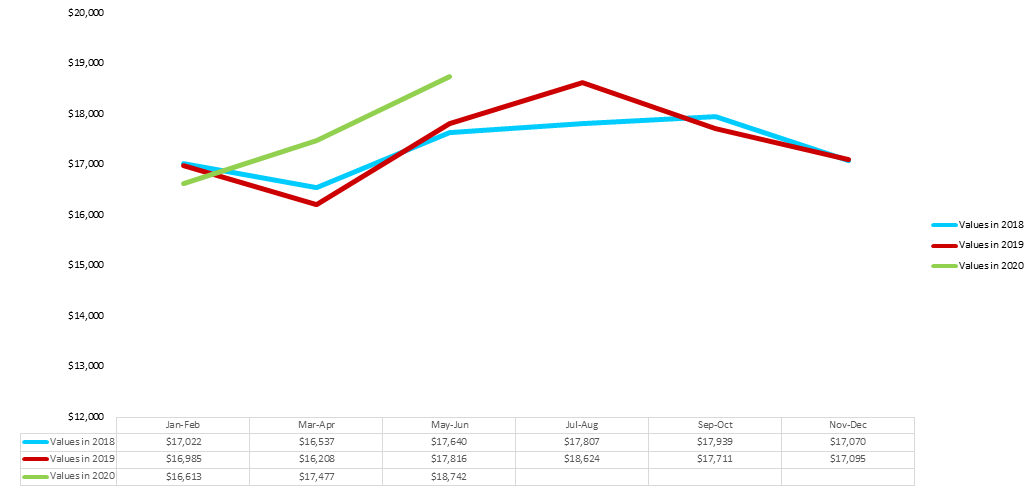
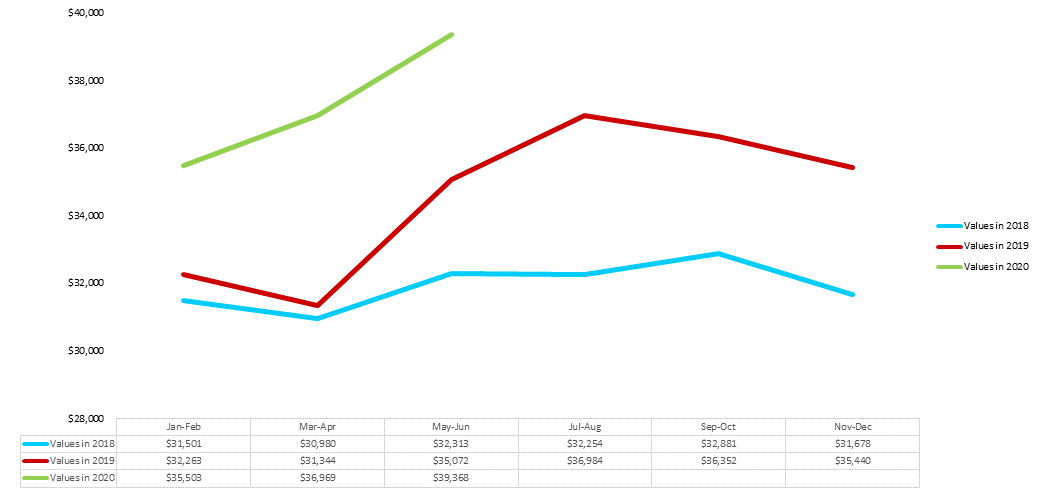
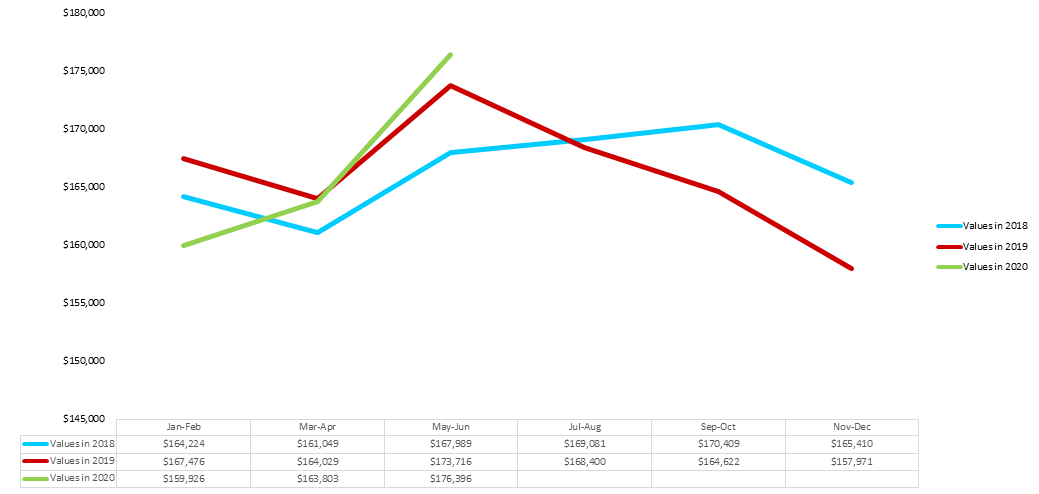
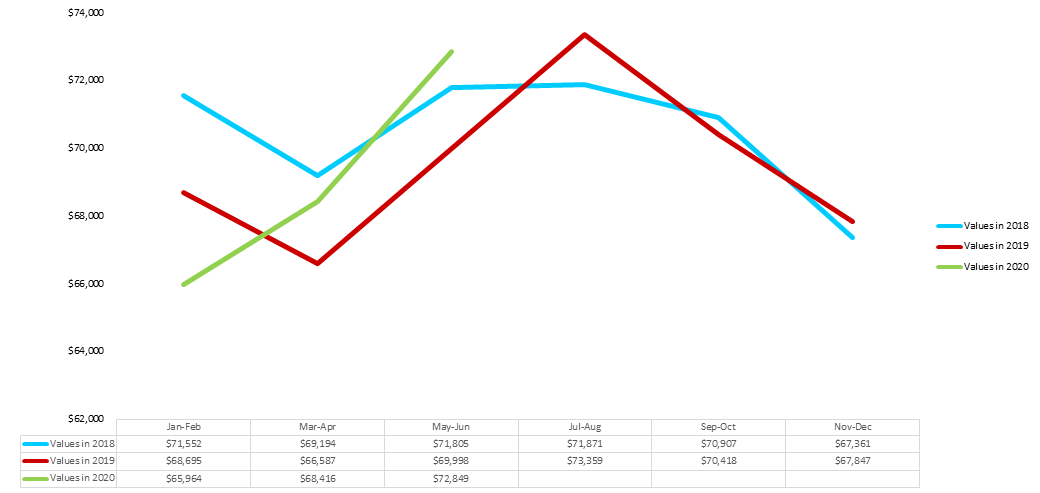
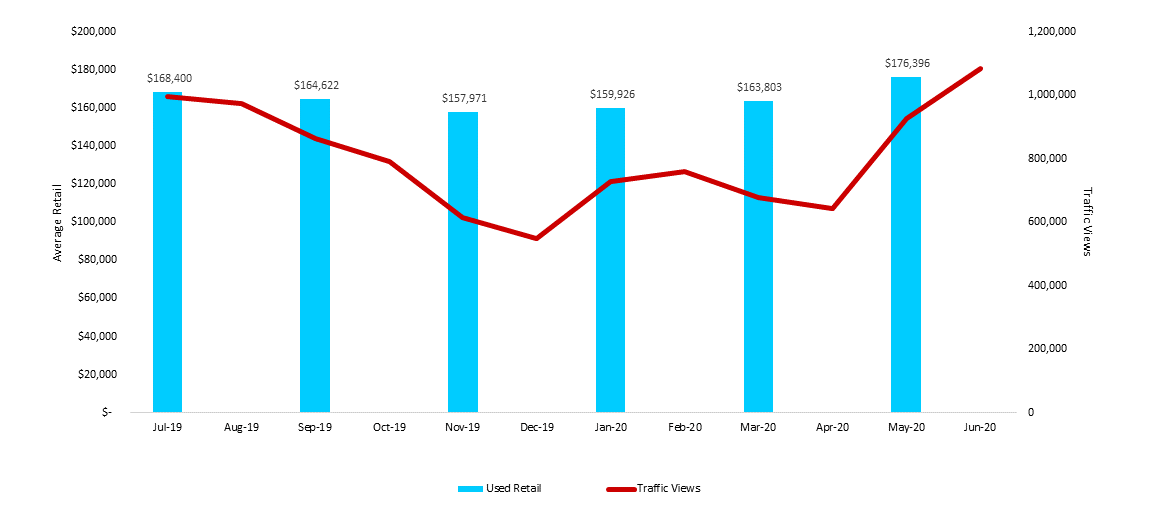
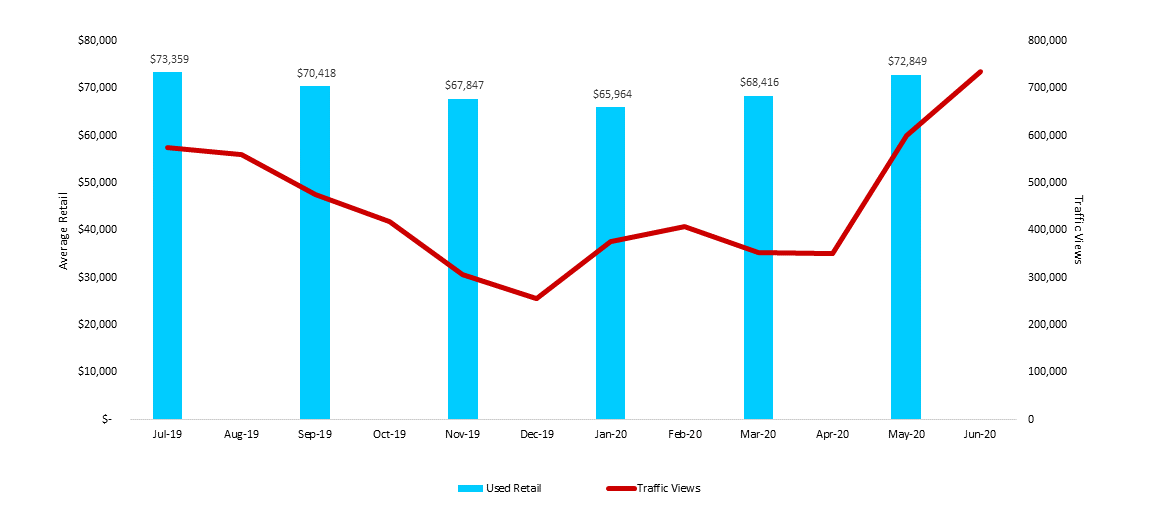
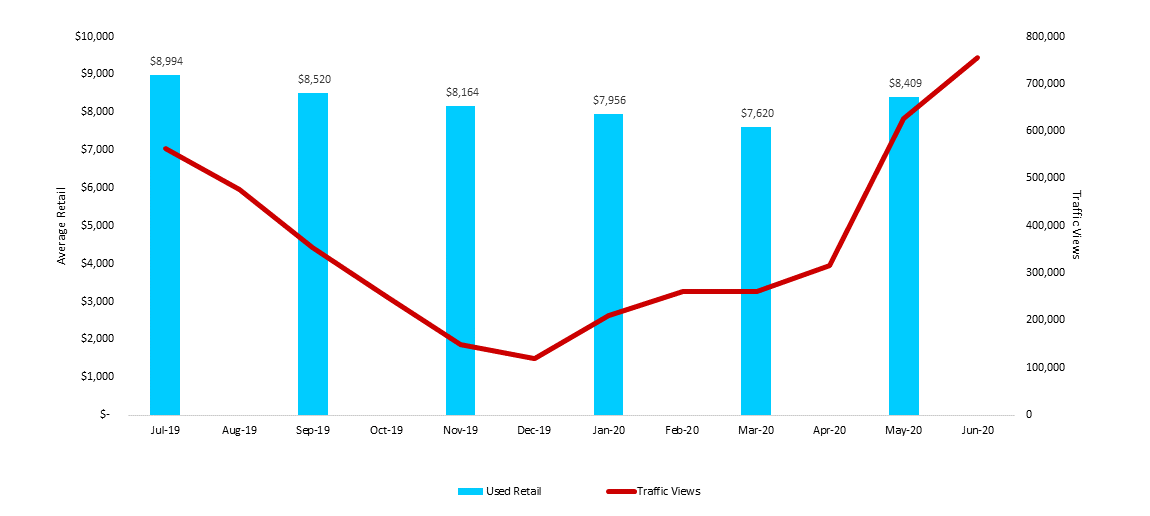
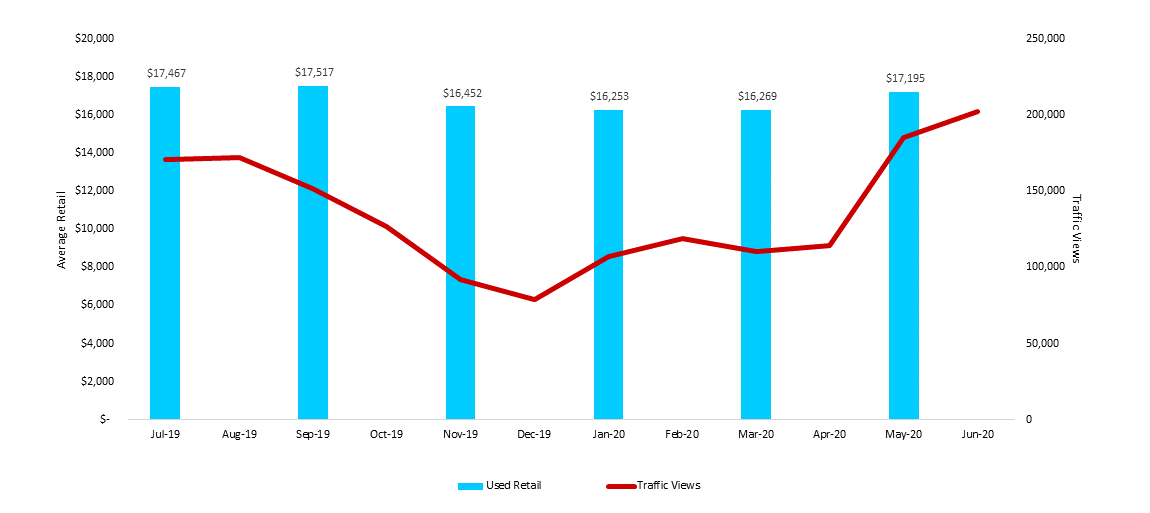
With this in mind, the strong performance of all the segments we track makes sense. Looking at travel trailers, standard hitch units are bringing 5.2% higher values year over year, and fifth wheel trailers continued their extremely strong run to come in 12.2% higher than last year. Motorhomes exploded in value going into the May June period, moving from trailing to leading the most recent three years. Camper trailers and truck campers also saw a nice seasonal bump to come in ahead of the most recent three years.
With dealership operations getting back to normal and demand healthy, the summer months look better than predicted. The economy has major challenges to work through, and we’re somewhat concerned about conditions in the fall. However, if layoffs in the mid high income segments remain under control in the 3 rd quarter, the RV industry will be well positioned to benefit from changes in vacation habits.
Travel Trailer Values
Used Retail Value by Category - Values for the Last 10 Model Years
Standard Hitch
Fifth Wheel
Motorhome Values
Used Retail Value by Category - Values for the Last 10 Model Years
Class A
Class C
Camping Trailer & Truck Camper Values
Used Retail Value by Category - Values for the Last 10 Model Years
Camping Trailer
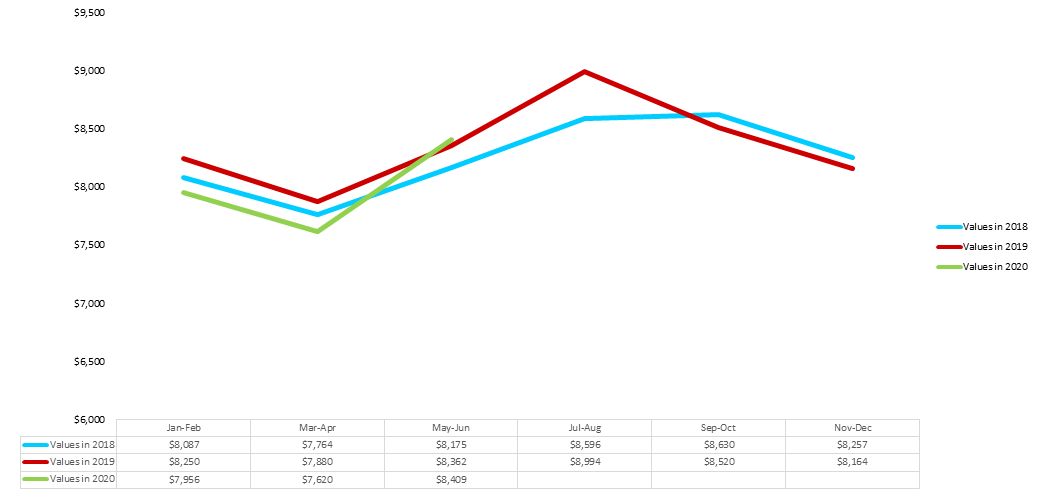
Truck Camper
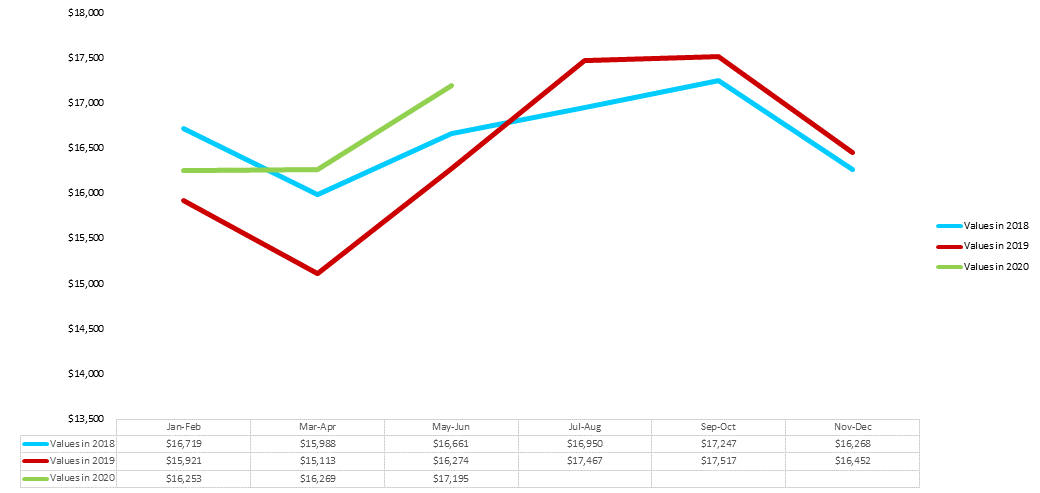
Travel Trailer Values vs. Traffic
Used Retail Value and Traffic Views by Category
Standard Hitch
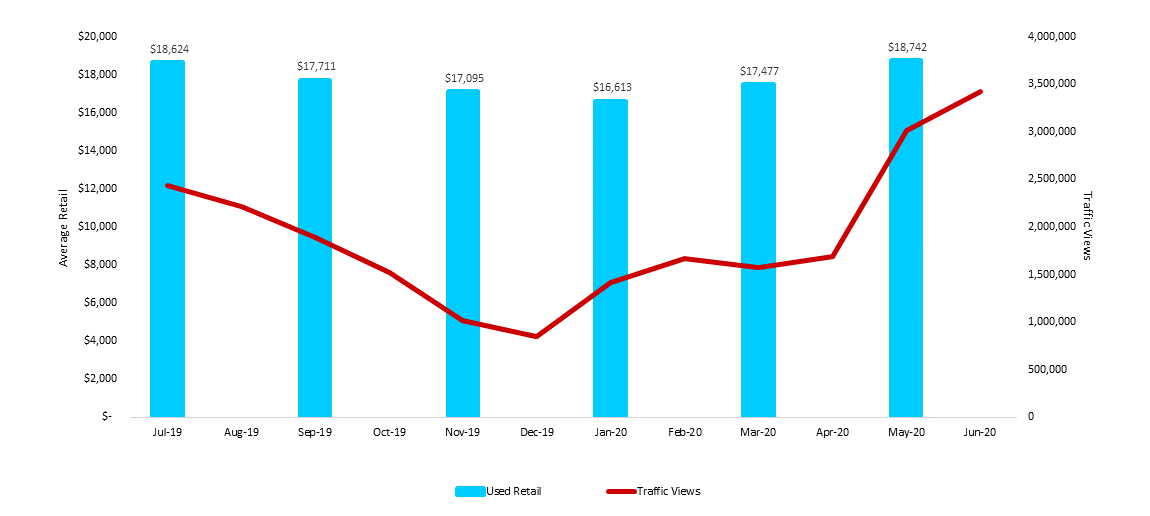
Fifth Wheel
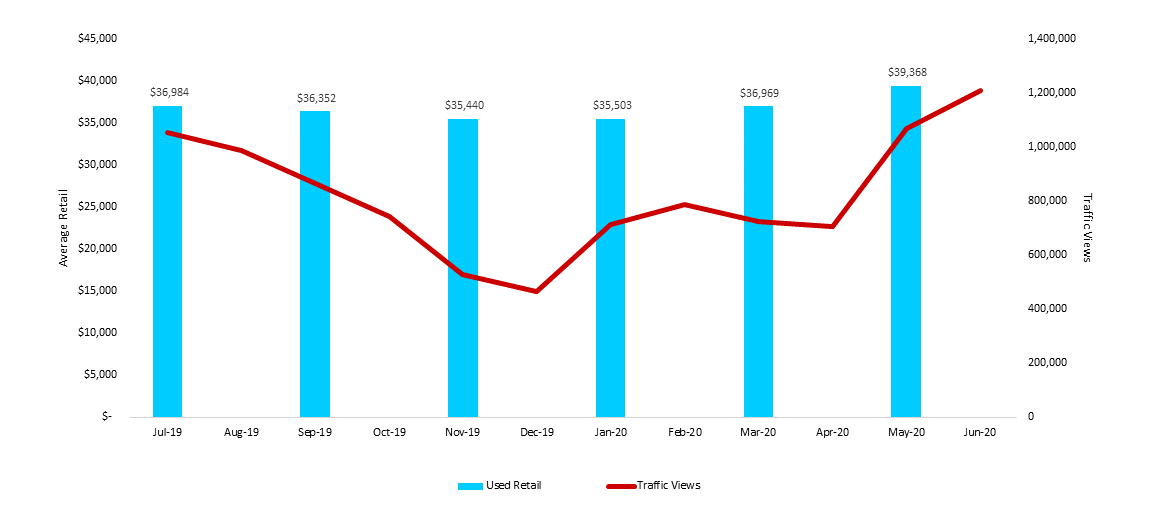
Motorhome Values vs. Traffic
Used Retail Value and Traffic Views by Category
Class A
Class C
Camping Trailer & Truck Camper Values vs. Traffic
Used Retail Value and Traffic Views by Category
Camping Trailer
Truck Camper
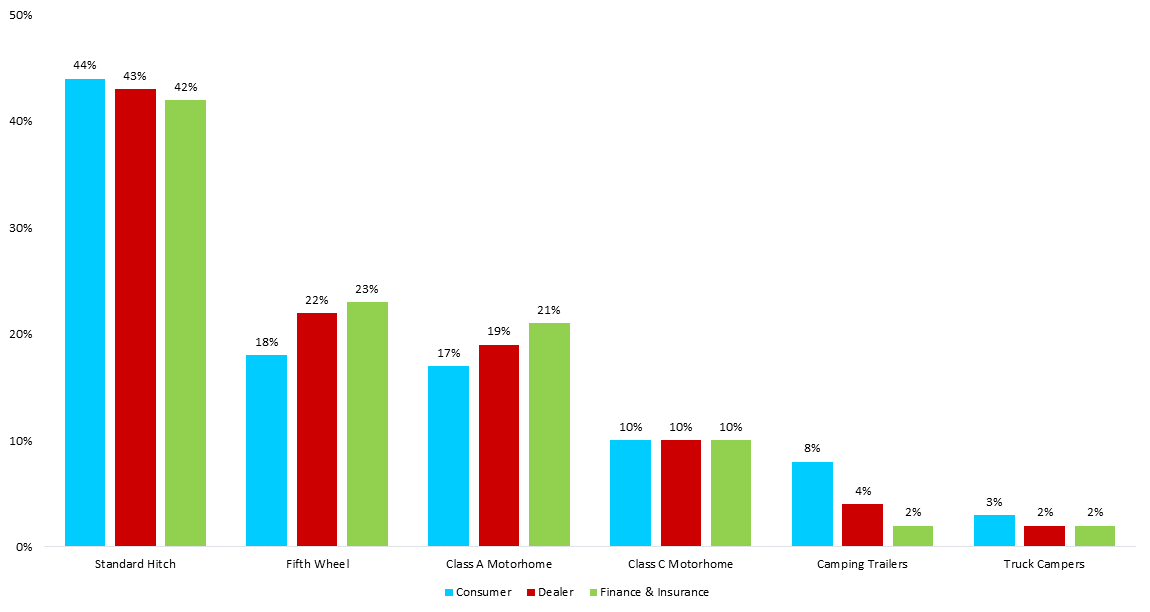
RV Categories
Category Views Among Consumers, Dealers, and Finance & Insurance Institutions in 2020 Q1-Q2
Travel Trailer Brands
NADAguides.com Top Researched Brands in 2020 Q1-Q2
Standard Hitch Brands
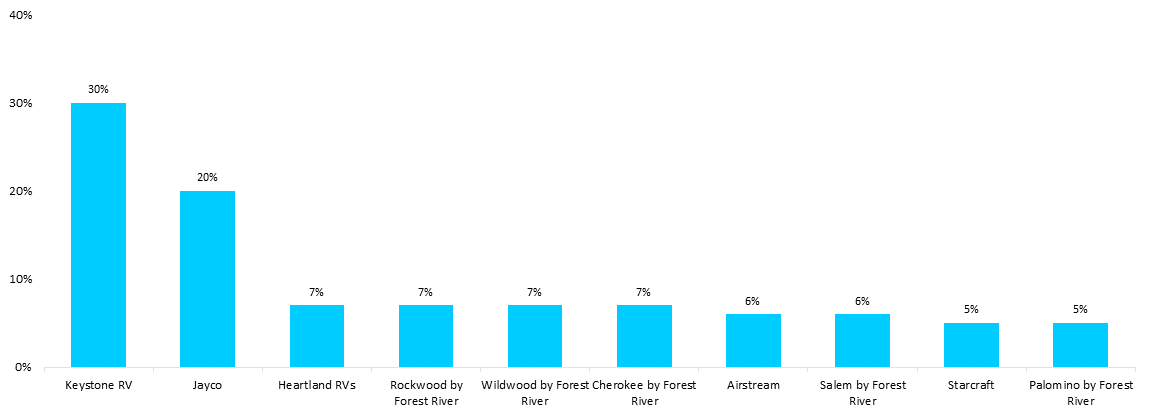
Fifth Wheel Brands
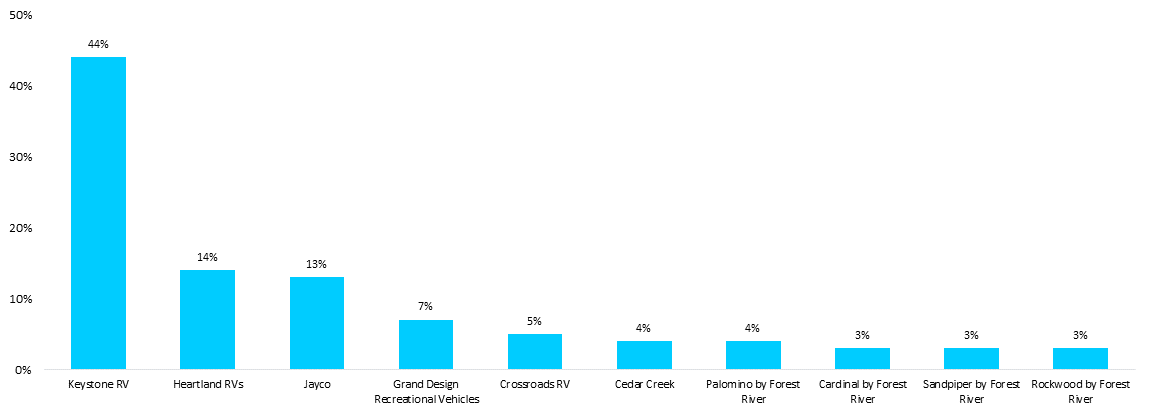
Motorhome Brands
NADAguides.com Top Researched Brands in 2020 Q1-Q2
Class A Brands
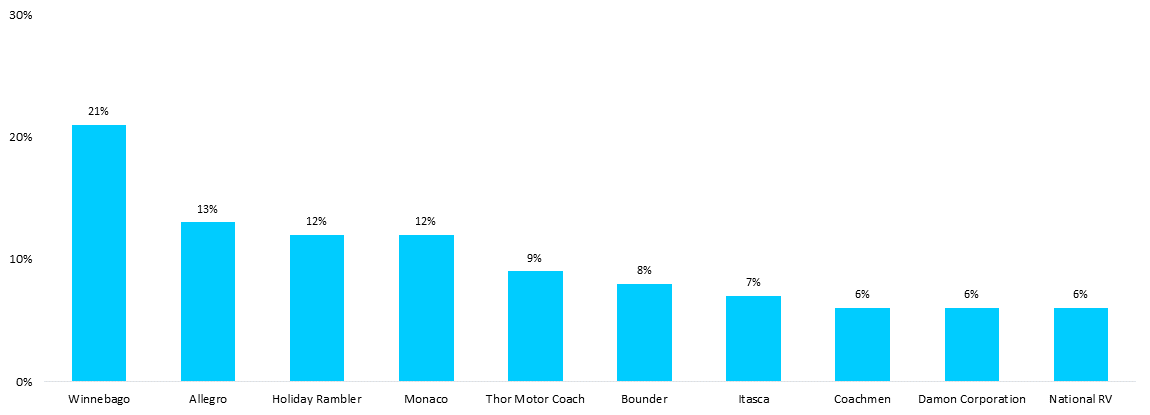
Class C Brands
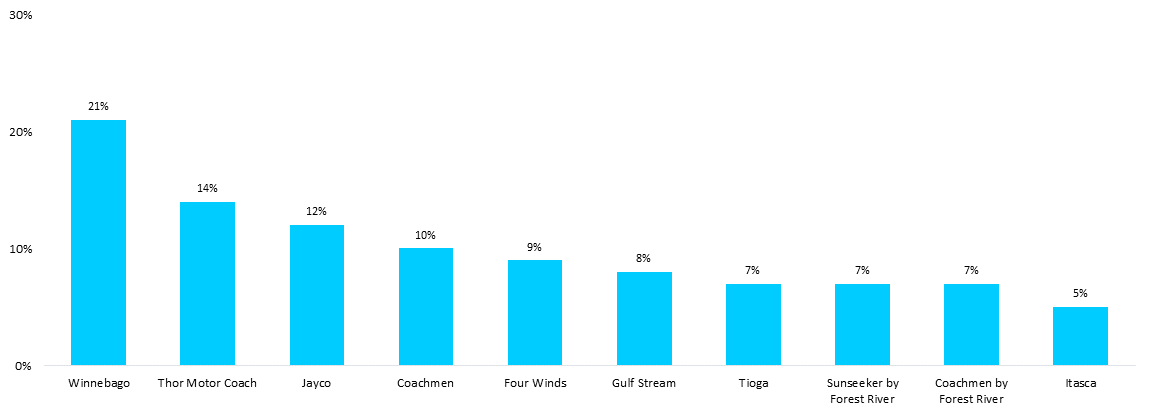
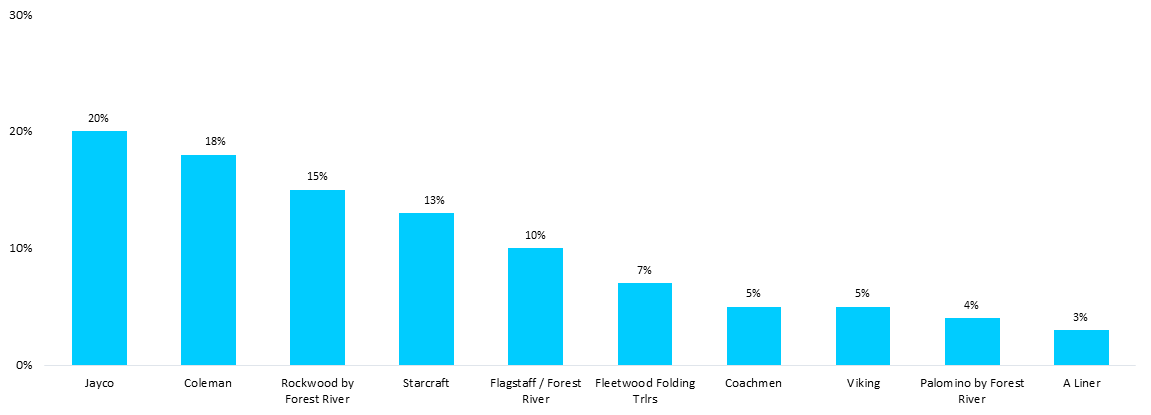
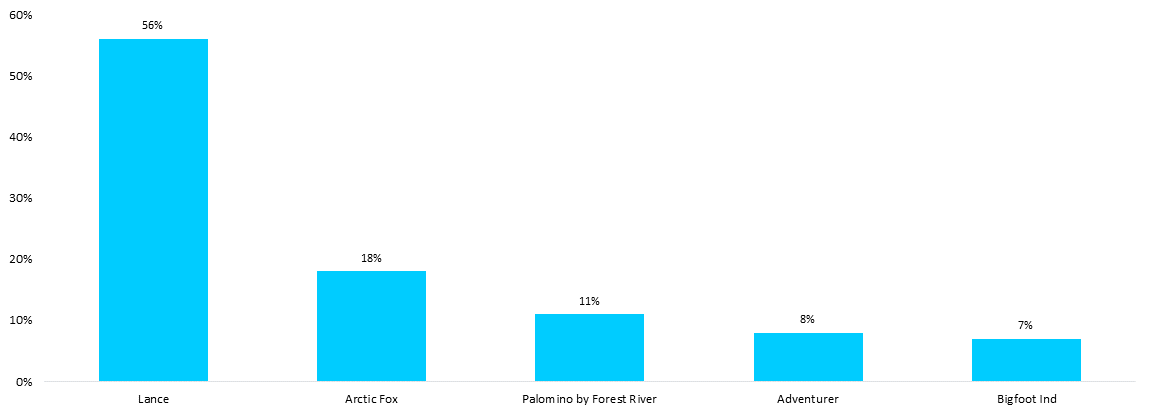
Camping Trailer & Truck Camper Brands
NADAguides.com Top Researched Brands in 2020 Q1-Q2
Camping Trailer Brands
Truck Camper Brands
Model Years
NADAguides.com Top Researched Model Years by Category
Standard Hitch Travel Trailer
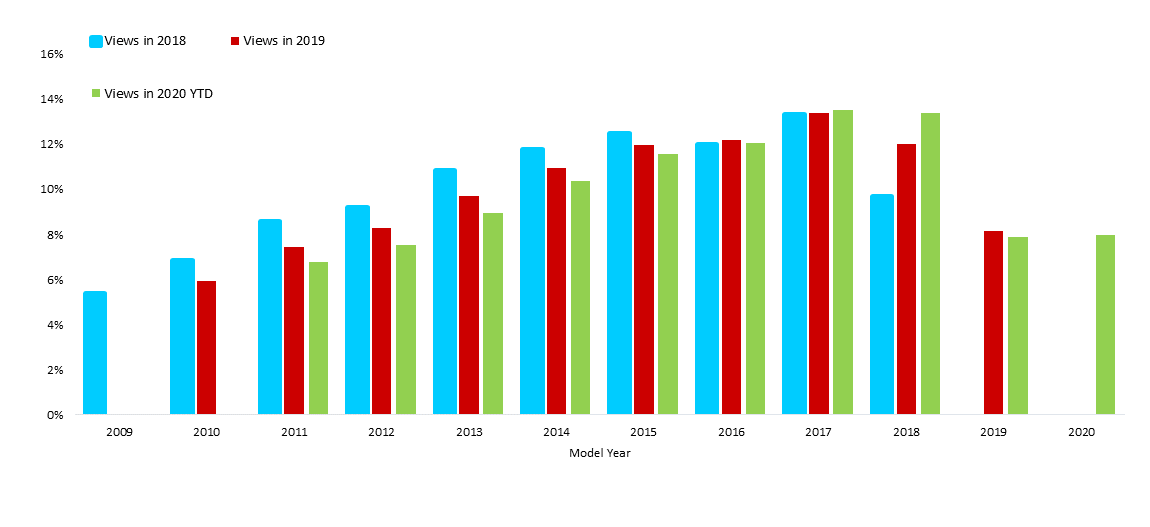
Class A Motorhome
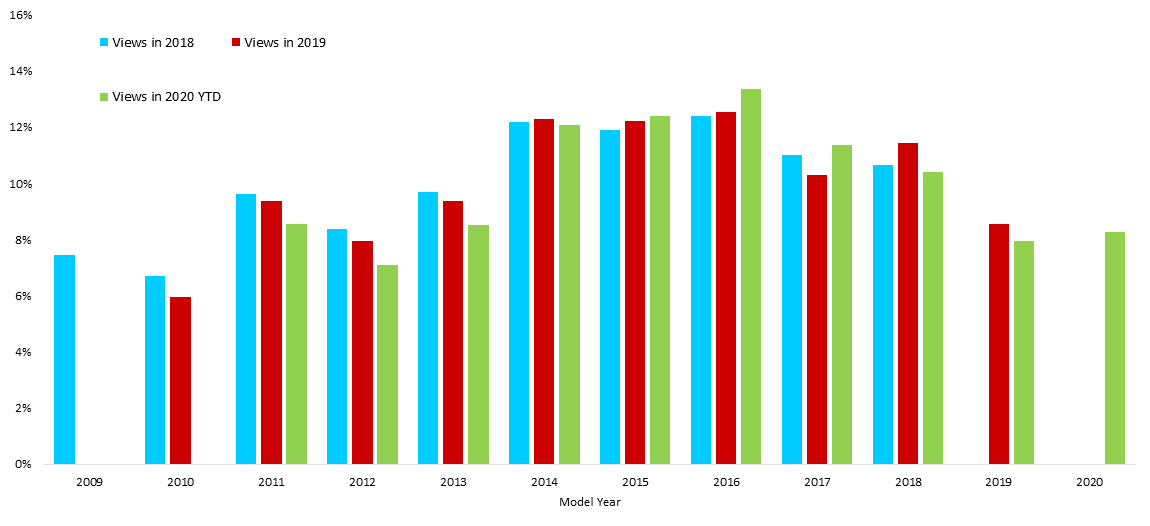
Web Traffic by State
Traffic by State in 2020 Q1-Q2
Travel Trailers
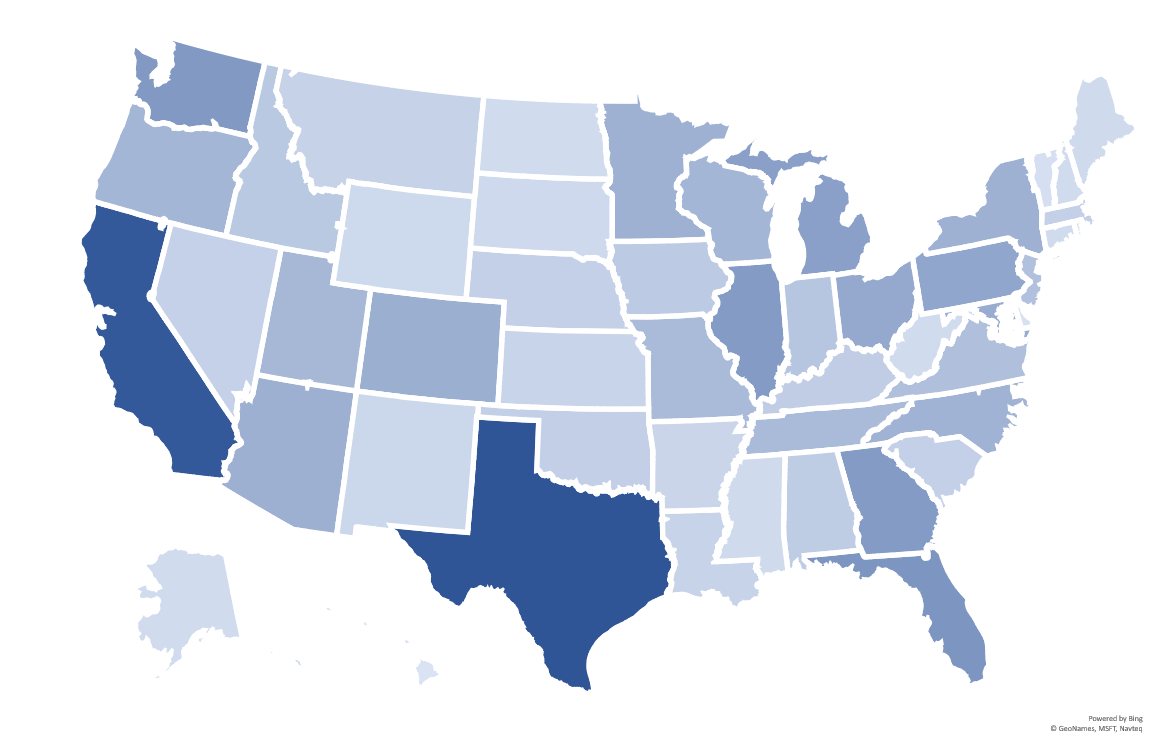
| > 200,000 | |
| 100,000 - 200,000 | |
| 50,000 - 99,999 | |
| < 50,000 |
Web Traffic by State
Traffic by State in 2020 Q1-Q2
Class C Motorhomes
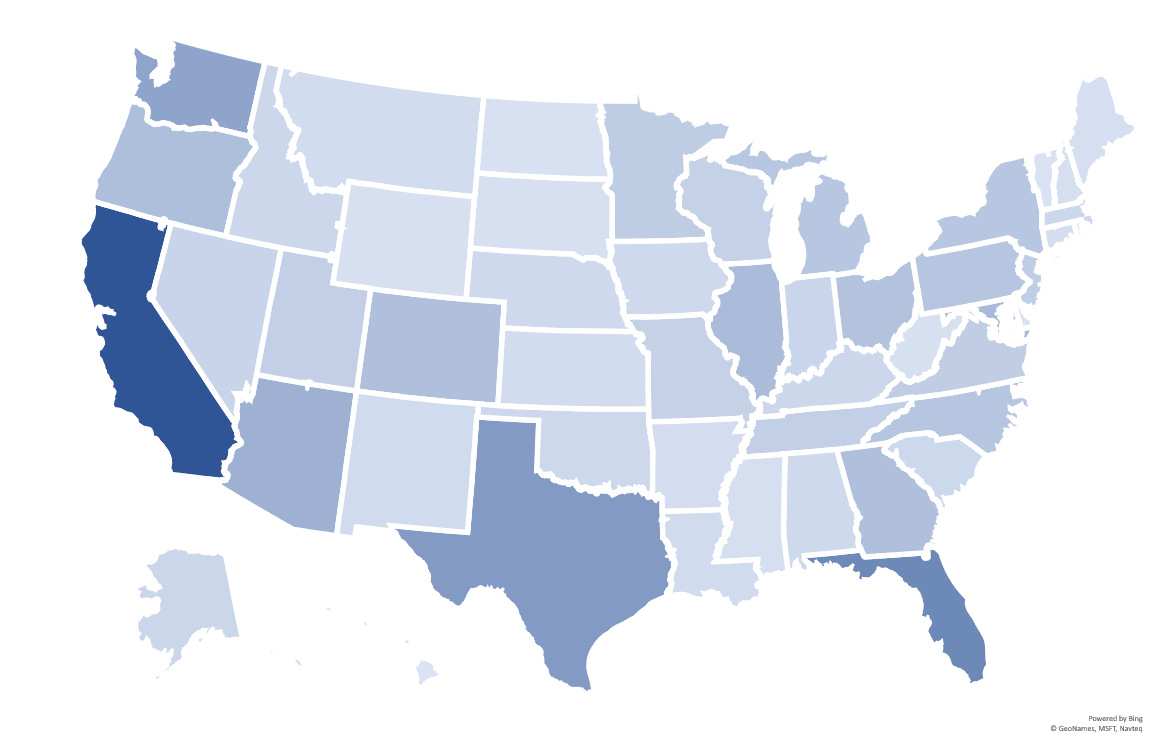
| > 60,000 | |
| 29,000 - 60,000 | |
| 15,000 - 28,999 | |
| < 15,000 |
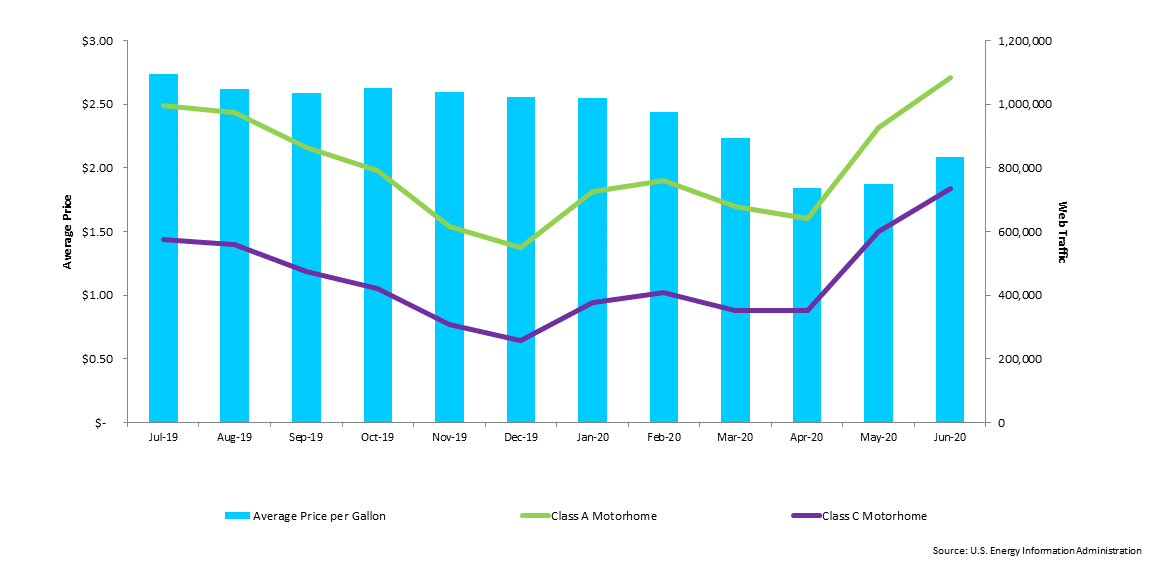
Fuel Price Data
Regular Grade Gasoline Prices vs. Consumer Traffic by Category
Travel Trailer / Fifth Wheel
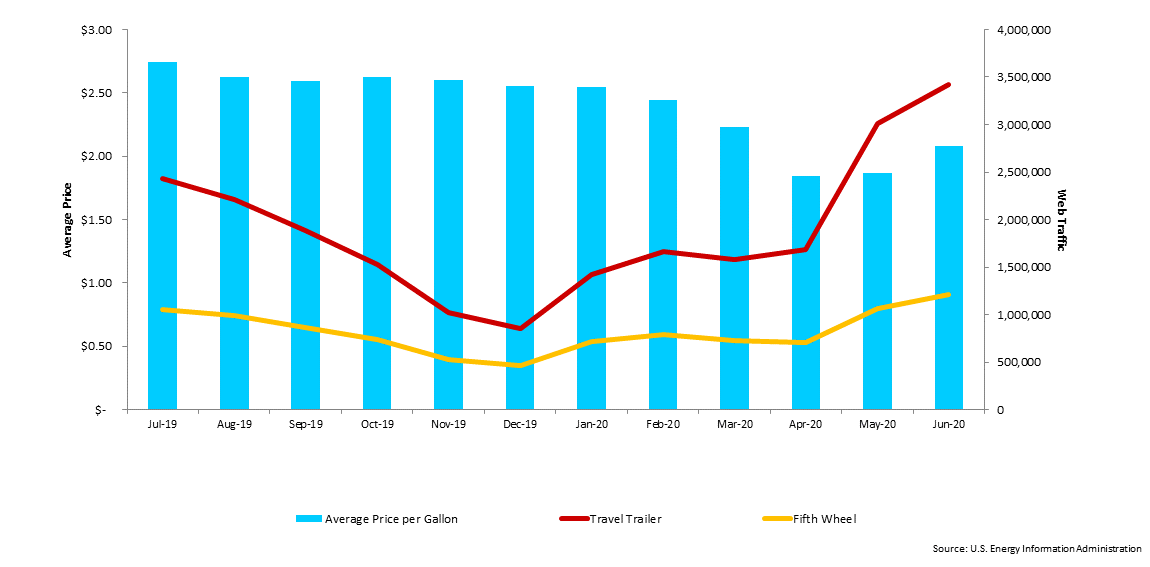
Motorhomes
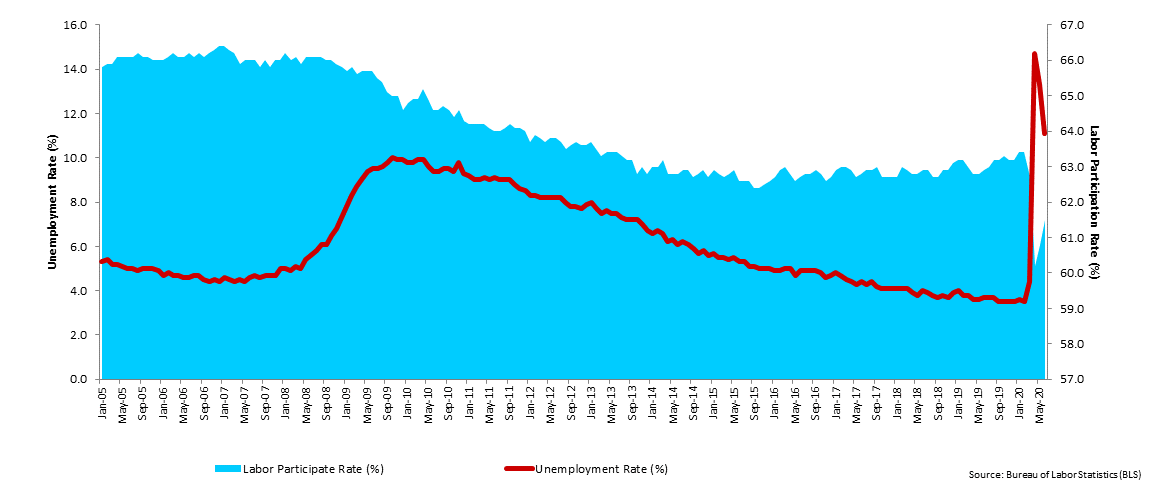
Economic Data
Unemployment & Labor Participation Rate (Seasonally Adjusted)
J.D. Power / NADAguides
Disclaimer
NADAguides, a division of J.D. Power, makes no representations about future performance or results based on the data and the contents available in this report (“Market Insights”). Market Insights is provided for informational purposes only and is provided AS IS without warranty or guarantee of any kind. By accessing Market Insights via email or the NADAguides website, you agree not to reprint, reproduce, or distribute Market Insights without the express written permission of NADAguides.
About NADAguides.com
NADAguides.com, the largest publisher of the most market-reflective vehicle pricing and information available for new and used cars, classic cars, motorcycles, boats, RVs and manufactured homes, offers in-depth shopping and research tools including a broad range of data, products and service and informational articles as well as tips and advice. NADAguides.com also produces electronic products, mobile applications, raw data, web services, web-syndicated products and print guidebooks. NADAguides.com is operated by NADAguides, a division of J.D. Power.

